
DATA ANALYSIS & BUSINESS INTELLIGENCE
More than numbers.
A clearer next move.
Your business already creates valuable data. NetPointDesigns helps turn it into reporting your team can understand and decisions you can explain.
Connect scattered sources, uncover useful patterns and replace repetitive reporting with a clearer view of what matters.
Let’s make your data useful ↗Connected reportingCustom dashboardsData qualityPractical insights
INSIGHT STUDIODEMO DATA
CONNECTED BUSINESS INTELLIGENCEYour next decision.
Your next decision.
In clearer view.
Performance over time
ILLUSTRATIVE · 6 PERIODSPeriod 1Period 3Period 6
Source mix
Compare sales patterns before choosing your next priority.
Sources → Model → Insight
Interactive demonstration. Figures are illustrative; no live business data is connected.


 Salesforce
 PostgreSQL
 MySQL
LESS REPORTING FRICTION. MORE CLARITY.One business.
One business.
A connected picture.
Sales in one system. Campaigns in another. A spreadsheet holding everything together. When the definitions do not match, even a simple question becomes a reporting project.
We start with the decisions you need to make, then work backwards through your data. The result is a reporting approach built around your people, your systems and the questions that matter.
WHAT WE CAN HELP YOU SEEFrom scattered information
From scattered information
to useful insight.
Connected data
Bring agreed CRM, ecommerce, analytics and operational sources into a consistent reporting workflow.
Data quality & preparation
Identify missing values, duplicates and inconsistent formats before they distort a business decision.
Business dashboards
Create focused Power BI or Looker Studio dashboards with practical filters, metric definitions and ownership.
Marketing & campaign analysis
Compare channels, acquisition journeys and campaign activity with a clear view of attribution limits.
Sales & ecommerce reporting
Explore product performance, customer journeys and sales patterns using the data your systems actually capture.
Operational analysis
Spot bottlenecks, compare workloads and investigate where processes need attention.
Forecasting & scenario planning
Use suitable historical data to explore possible outcomes, with assumptions and uncertainty made explicit.
Automated reporting
Reduce repeated spreadsheet tasks with scoped refresh pipelines, validation and documented reporting routines.
WHAT’S INCLUDEDA dashboard is only
A dashboard is only
part of the answer.
Reliable reporting needs clear definitions, dependable inputs and people who know how to use it.
- Discovery & reporting plan
- Business questions, audience, KPIs and an agreed delivery scope.
- Source & quality review
- Access requirements, data gaps, reconciliation and transformation rules.
- Dashboard & analysis
- Purposeful visualisations, useful filters and findings with context.
- Validation & handover
- Source checks, metric documentation, refresh ownership and a walkthrough for your team.
WHY BUSINESSES TRUST OUR APPROACHClear numbers.
Clear numbers.
Responsible interpretation.
Questions before charts
Every report starts with a decision, rather than a collection of impressive-looking visuals.
Connected to your workflow
Reporting fits the systems and routines your team uses, with supported integrations scoped around available access.
Definitions you can follow
Calculations, assumptions and data limitations are documented so your team can interpret the numbers confidently.
The work. The thinking. The story.
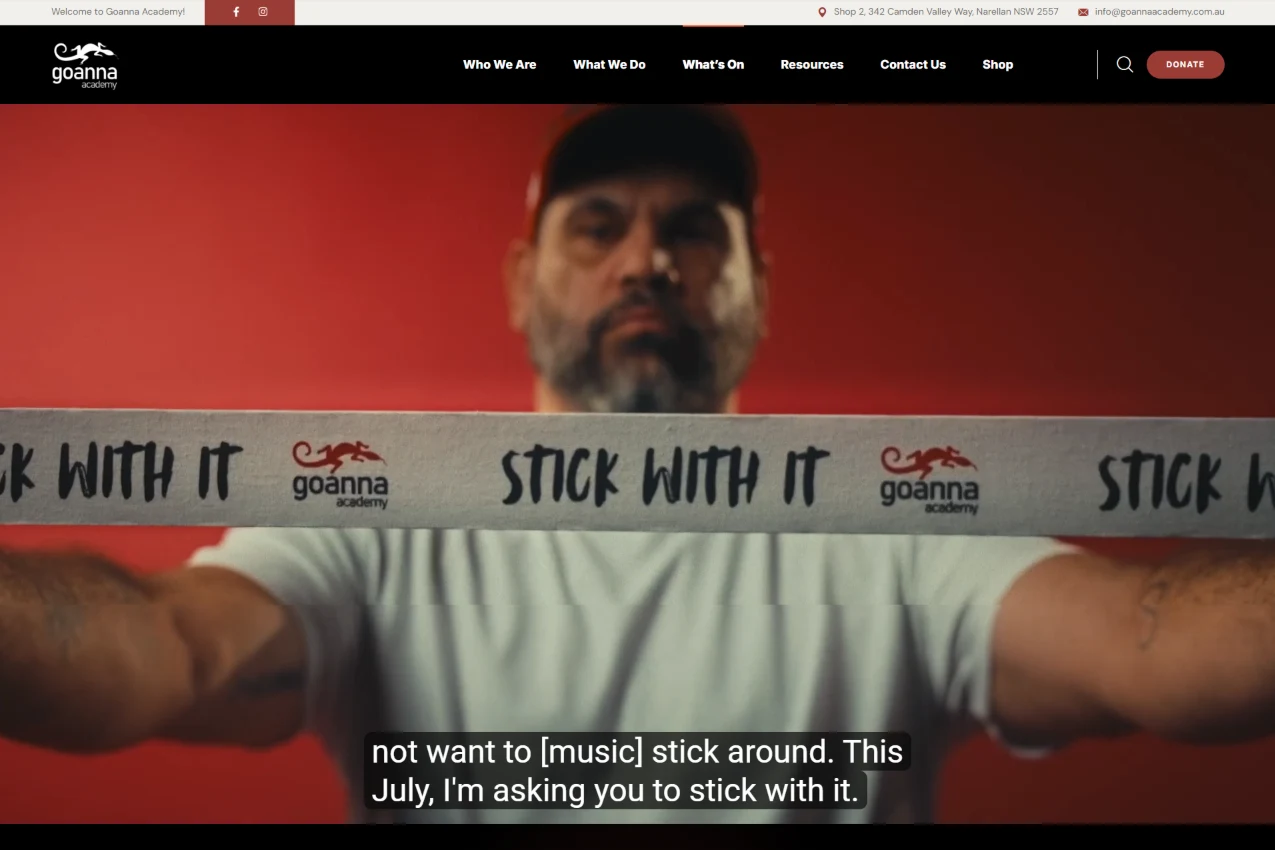
WEBSITE · DATA · CAMPAIGNS
Goanna Academy
A website rebuild, Shopify, SEO, dashboards and automation supporting the Goanna team and Stick With It 2026.
View case study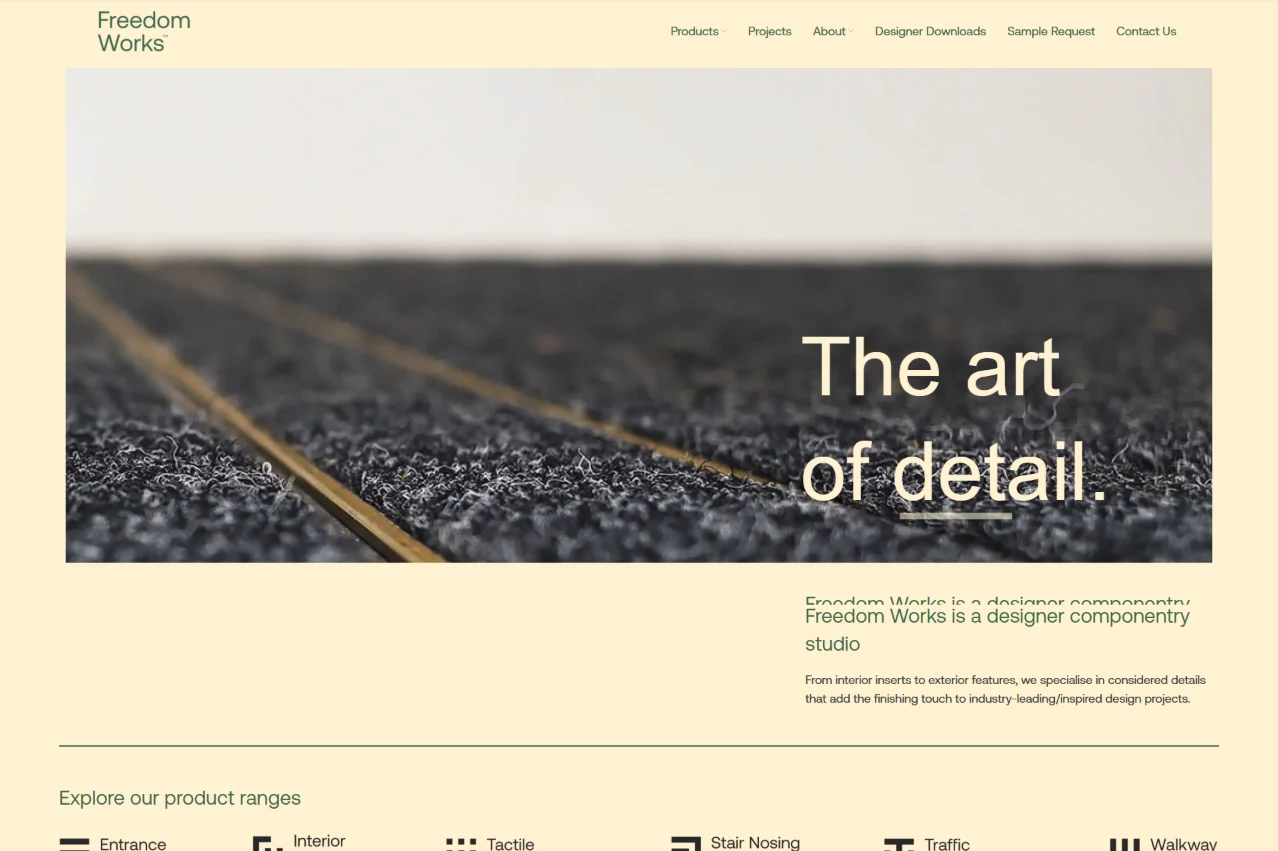
WEBSITE · BRAND · SEO
Freedom Works
From Freedom Strategies Ltd to Freedom Works: a new website, useful architect resources and a stronger digital foundation.
View case study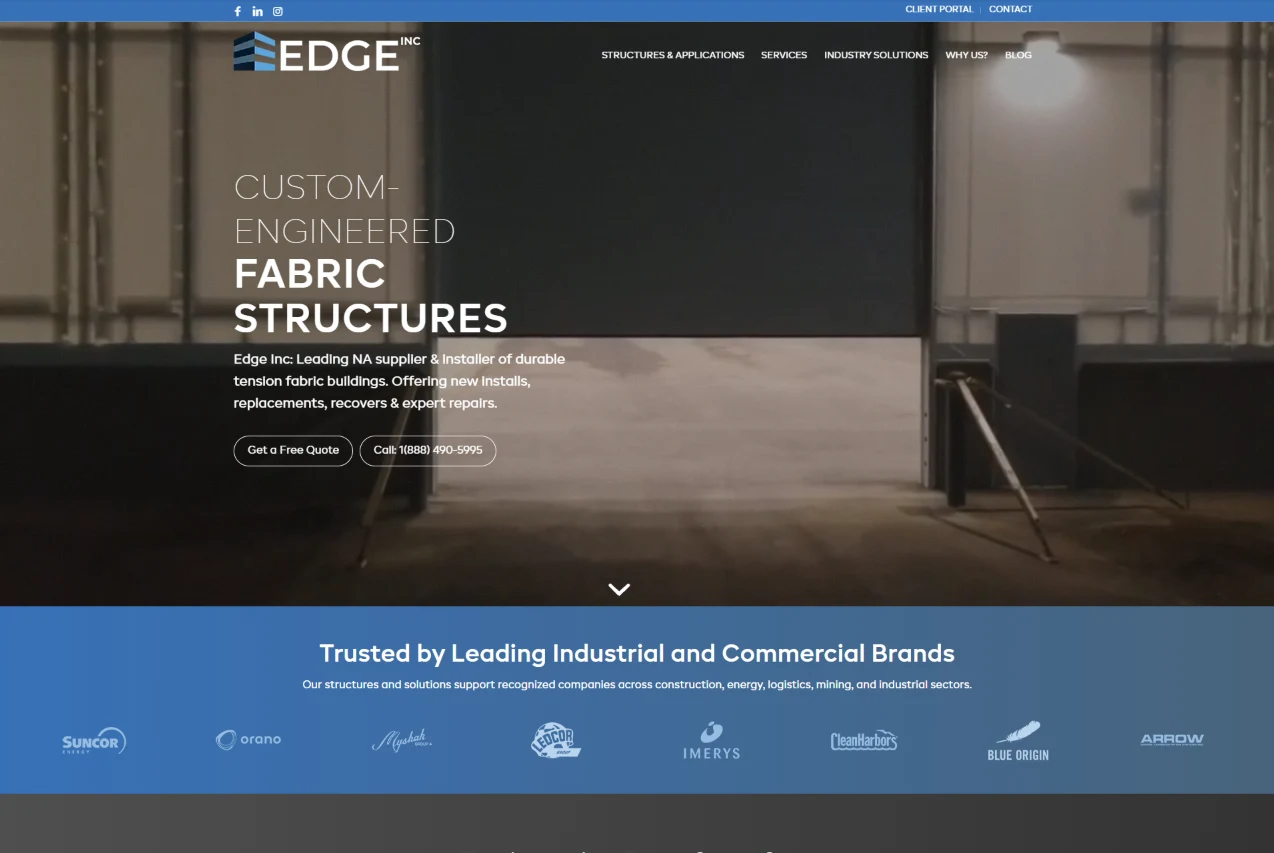
WEBSITE · BRAND · SEO
Edge Innovates
From Edge Innovation to Edge Innovates: brand alignment, website improvements, search, creative and connected marketing operations.
View case studyYour data questions.
Clearer answers.
What data can you analyse?
We can scope work around sales, ecommerce, marketing, CRM and operational data. Source access, quality, volume and permissions determine the practical approach.
Can you combine data from different systems?
Yes, where supported APIs, exports or database access are available. We agree identifiers, refresh frequency and validation rules before connecting sources.
Do you build Power BI and Looker Studio dashboards?
We can scope dashboards in these tools around your reporting requirements. Platform licensing, source connectors and ownership are agreed during discovery.
Can you forecast sales or demand?
Where enough suitable historical data exists, we can assess forecasting and scenario analysis. Forecasts carry uncertainty and are not guarantees of future results.
How do you handle sensitive information?
We agree the minimum necessary data, authorised access, storage and retention requirements before work begins. Access is limited to the agreed project scope.
Can you improve an existing dashboard?
Yes. We can review calculations, usability, source consistency and refresh behaviour, then prioritise the changes that make the report more useful.
How much does a data analysis project cost?
The number of sources, data preparation, reporting complexity and refresh requirements shape the proposal. We agree a useful first scope before estimating the work.
START WITH A BETTER QUESTIONWhat could your data
What could your data
help you decide?
Tell us about your systems, your reporting challenges and the questions your team needs answered.
Discuss your data project ↗